Mullen Automotive (MULN) Stock Price Forecast & Prediction 2024, 2025, 2030 — Is MULN Stock a Good Investment?
 By:C, Fiona
Mullen Automotive (NASDAQ:MULN), an electric vehicle (EV) manufacturer based in California, has no assurances of success in five or ten years. This year, however, MULN stock has a realistic opportunity to double, triple, or even increase further. And this does not have to involve a reverse share split as a fast fix.
Do not form the incorrect impression. Mullen Automotive has cast doubt on the company’s viability as a “continuing concern.” Therefore, it is not prudent to invest one’s entire portfolio in shares of Mullen Automotive.
On the other hand, a modest stake with a high but reasonable price target may produce unexpectedly favourable results. Even though there is a lot of competition in the EV market, don’t count out Mullen Automotive just yet.
What is Mullen Automotive (MULN) ?
Rapid transformation is occurring in the automotive sector. The market for automobiles, for example, is being shaken up. Ten percent of 2022 U.S. vehicle sales were EVs, according to estimates. Another shift has occurred in China, where local brands have captured an increasingly sizable portion of the country’s retail sales.
For example, Mullen Automotive (MULN) is competing with Tesla and other electric vehicle (EV) manufacturers to become the industry standard. Its cars are being assembled in the Golden State. It is also investigating solid-state battery technology, which, if successful, might lead to the development of superior batteries. Mullen also manages the automobile marketplace CarHub.
More importantly, Mullen Automotive (MULN) has been relatively acquisitive. The company spent $240 million to buy Electric Last Mile Solutions (ELMS) in 2022. A 60.5% interest in electric truck manufacturer Bollinger Motors was also acquired.
Autos such the Mullen FIVE, Mullen FIVE RS, the Mullen Class 1 van, the Mullen Class 3, as well as the Bollinger B1, B2, I-GO, and B4 platform are all being produced by Mullen.

| Download App for Android | Download App for iOS |
Mullen Automotive (MULN) Stock Overview

| Stock | Mullen Automotive, Inc. |
| Last Price | $ 0.197 |
| Rank | 6816 |
| Market Cap | $ 12.2M |
| 24H Trading Volume | $ 17.2M |
| Exchange | NASDAQ |
| Open | $ 0.22 |
| Previous Close | $ 0.22 |
| High | $ 0.23 |
| Low | $ 0.19 |
| ATH | $ 34.44 / 2017-12-21 |
| Website | |
| CEO | |
| Total Employees | |
| Industry | |
| Address | |
| City | |
| State | |
| Country | |
| Zip | |
| Phone | |
| Update Time | 2025-02-16 05:17:01 |
Mullen Automotive (MULN) Stock Price History
| Date | Open | High | Low | Close | Volume |
| 2018-02-16 | $ 6.67 | $ 6.77 | $ 6.31 | $ 6.31 | 151.5K |
| 2021-02-16 | $ 14.15 | $ 14.65 | $ 13.68 | $ 14.06 | 282.4K |
| 2022-02-16 | $ 0.96 | $ 0.99 | $ 0.80 | $ 0.87 | 18.2M |
| 2023-02-16 | $ 0.34 | $ 0.34 | $ 0.29 | $ 0.29 | 220.1M |
| 2024-02-16 | $ 8.37 | $ 9.50 | $ 8.20 | $ 9.13 | 2.6M |

| Download App for Android | Download App for iOS |
Mullen Automotive (MULN) Stock Price Performance
| Price Change 1H Percent | -27.41% |
| Price Change 1D Percent | -12.25% |
| Price Change 7D Percent | -9.84% |
| Price Change 30D Percent | -59.48% |
| Price Change 90D Percent | -92.31% |
| Price Change 365D Percent | -97.84% |
Mullen Automotive (MULN) Stock Technical Analysis
All financial markets use moving averages (MA), a well-liked indicator that smoothes price movement over a predetermined period of time. Since they are a trailing indication, past price activity has an impact on them. The simple moving average (SMA) and exponential moving average (EMA) are the two forms of moving averages shown in the table below.
Daily Simple Moving Average (SMA) & Daily Exponential Moving Average (EMA)
Date Calculated:2025-02-16
| 3_SMA | $ 0.24 | 3_EMA | $ 0.20 |
| 5_SMA | $ 0.24 | 5_EMA | $ 0.22 |
| 10_SMA | $ 0.24 | 10_EMA | $ 0.24 |
| 20_SMA | $ 0.30 | 20_EMA | $ 0.33 |
| 21_SMA | $ 0.31 | 21_EMA | $ 0.34 |
| 50_SMA | $ 0.87 | 50_EMA | $ 0.81 |
| 100_SMA | $ 1.80 | 100_EMA | $ 1.37 |
| 200_SMA | $ 2.17 | 200_EMA | $ 1.99 |
Weekly Simple Moving Average (SMA) & Weekly Exponential Moving Average (EMA)
Date Calculated:2025-02-16
| 21_SMA_weekly | $ 1.90 | 21_EMA_weekly | $ 1.27 |
| 50_SMA_weekly | $ 2.68 | 50_EMA_weekly | $ 2.05 |
| 100_SMA_weekly | $ 2.24 | 100_EMA_weekly | $ 2.45 |
| 200_SMA_weekly | $ 3.63 | 200_EMA_weekly | $ 3.14 |

| Download App for Android | Download App for iOS |
Mullen Automotive (MULN) Stock Forecast for Today, Tomorrow and Next Week

| Date | Price Prediction | Change |
| 2025-02-16 | $ 0.20 | 0.00% |
| 2025-02-18 | $ 0.20 | 0.10% |
| 2025-02-21 | $ 0.20 | 0.07% |
| 2025-02-24 | $ 0.20 | -0.25% |
| 2025-02-27 | $ 0.20 | -0.35% |
| 2025-03-02 | $ 0.20 | -0.28% |
| 2025-03-05 | $ 0.20 | -0.44% |
| 2025-03-08 | $ 0.20 | -0.42% |
| 2025-03-11 | $ 0.20 | -0.33% |
| 2025-03-14 | $ 0.20 | -0.18% |
| 2025-03-17 | $ 0.20 | -0.18% |
Mullen Automotive (MULN) Stock Forecast for 2025-2050

| Year | Yearly Low | Yearly Average | Yearly High |
| 2025 | $ 0.18 | $ 0.20 | $ 0.25 |
| 2026 | $ 0.26 | $ 0.29 | $ 0.35 |
| 2027 | $ 0.31 | $ 0.35 | $ 0.44 |
| 2028 | $ 0.33 | $ 0.37 | $ 0.47 |
| 2029 | $ 0.34 | $ 0.39 | $ 0.48 |
| 2030 | $ 0.39 | $ 0.44 | $ 0.53 |
| 2035 | $ 0.37 | $ 0.43 | $ 0.52 |
| 2040 | $ 0.47 | $ 0.54 | $ 0.65 |
| 2045 | $ 0.49 | $ 0.55 | $ 0.71 |
| 2050 | $ 0.50 | $ 0.58 | $ 0.70 |
| Download App for Android | Download App for iOS |
Mullen Automotive (MULN) Stock Forecast 2024
The NASDAQ: MULN chart shows that Mullen stock is declining sharply right now. At its current level, the stock is trading 90.5% lower than its all-time high.
Having said that, you should take into account a few encouraging signals. Two popular financial indicators, the RSI and the MFI, are presently displaying a positive divergence. This could signal a short-lived upswing in the stock price or perhaps a relief bounce.
These factors apart, the long-term outlook for Mullen stock is negative so long as prices stay inside the falling wedge formation shown on the chart.
Mullen Automotive (MULN) Stock Forecast 2025
Although Mullen Automotive’s 2025 performance may be optimistic, it is unlikely to match the ATH of the past year. We anticipate that the average price of Mullen Automotive shares will be $0.94 by the year 2025. Our highest Mullen Automotive price target for 2025 is $1.42, assuming the company maintains its present rate of growth.
If the market becomes bearish, Mullen Automotive might drop to a low of about $0.73. Yet if the market turns bullish in 2025, Mullen Automotive could see even greater growth than we anticipate.
| Download App for Android | Download App for iOS |
Mullen Automotive (MULN) Stock Forecast 2030
If you’re willing to wait until 2030, investing in shares of Mullen Automotive could pay off handsomely. In line with our long-term Mullen Automotive stock forecast, we anticipate their value to reach a new ATH level in 2018. The average value of Mullen Automotive could reach $5.69 by the year 2030.
We may be underestimating Mullen Automotive’s potential for growth if the market suddenly becomes positive. At $7.46 is about as high as Mullen Automotive’s price may go in 2030. Mullen Automotive, however, has the potential to be worth as little as $3.53 if the market becomes pessimistic.
Mullen Automotive (MULN) Earnings History
| Report Date | Forecasted EPS | Reported EPS | Last Year’s EPS | EPS YoY Change |
| 2025-02-14 | - 0.00 | - 0.00 | - -85.13 | -100.00% |
| 2025-01-17 | - 0.00 | - -38.42 | - -1.62 | 2271.75% |
| 2024-05-14 | - 0.00 | - -19.39 | - -639.06 | -96.97% |
| 2024-02-13 | $ 3600.00 | - -1532.00 | - -0.28 | 547042.86% |
| 2024-01-16 | - 0.00 | - -85.13 | - -16495.00 | -99.48% |
| 2023-08-14 | $ 36.00 | - -1.62 | - -3600.36 | -99.96% |
| 2023-05-15 | - 0.00 | - -639.06 | - -0.68 | 94565.74% |
| 2023-02-14 | - 0.00 | - -0.28 | - -3.37 | -91.69% |
| 2023-01-13 | - 0.00 | - -16495.00 | - -0.63 | 2627329.12% |
| 2022-08-12 | - 0.00 | - -3600.36 | $ 0.05 | -7200820.00% |
\
| Download App for Android | Download App for iOS |
Will Mullen Automotive (MULN) Stock Recover?
Many investors may be wondering if Mullen Automotive stock will rebound from its recent price of virtually $0. Based on its recent performance, MULN stock doesn’t appear to be making a quick comeback. We anticipate that Mullen Automotive stock will reach $1 by the end of 2026.
Yet, with enough time and effort, almost anything is possible in the stock market. It’s not easy to assert that stock market predictions can be correct, given how quickly a tremendous bull run or bear rally may obliterate them. Mullen Automotive’s stock price could rise sooner than we expect if more investors decide to buy into the company.
Is MULN Stock a Good Investment?
There are a number of reasons why we think MULN stock is a bad investment. To begin, the firm does not have a tried and true technology. This means that investors are placing their faith in the company’s future success and the efficacy of its technologies.
Second, millions of dollars in cash are being wasted every month by Mullen’s cash incinerator. Because of this, the likelihood of the company going bankrupt in the near future is increased, as previously noted. For the third, Mullen has a checkered past. The company’s original plan included erecting an electrified saloon, for instance. Their next plan was to show the American market the Qiantu K50 from China. It has spread to other vehicles, such delivery trucks.
As I also mentioned in my Rivian stock price prediction, I have my doubts about the long-term viability of electric vehicles in the United States. When it comes to automobiles, I anticipate that vehicles powered by internal combustion engines (ICEs) will maintain a large market share for the foreseeable future. Last but not least, recalls and other costs add up to the billions of dollars needed to develop a successful electric vehicle firm.
| Download App for Android | Download App for iOS |
FAQs
1.What is the outlook for Mullen Automotive (MULN) stock?
Predicting the future price of Mullen Automotive stock, or any other stock, is difficult. While market sentiment is currently gloomy, the performance of Mullen Automotive stocks appears to be more volatile.
2.Can we see a decline in Mullen Automotive (MULN) stock?
One of the most volatile stocks on the market, Mullen Automotive (MULN) has had its share price drop by 95% since its IPO. Some market watchers predict another drop in MULN shares.
3.In what condition will Mullen Automotive stock be in the next five years?
Considering the stock’s recent history, it’s possible that Mullen’s growth may be sluggish over the next few months. Although a positive outlook for Mullen Automotive’s future can be inferred from a number of indicators, including the company’s financial performance, the demand for, and the supply of Mullen Automotive products, and many others, many variables will determine the actual value of Mullen Automotive stock in five years. If growth continues at its current clip, our price target for Mullen Automotive shares is $1, which might be reached within the next five years.
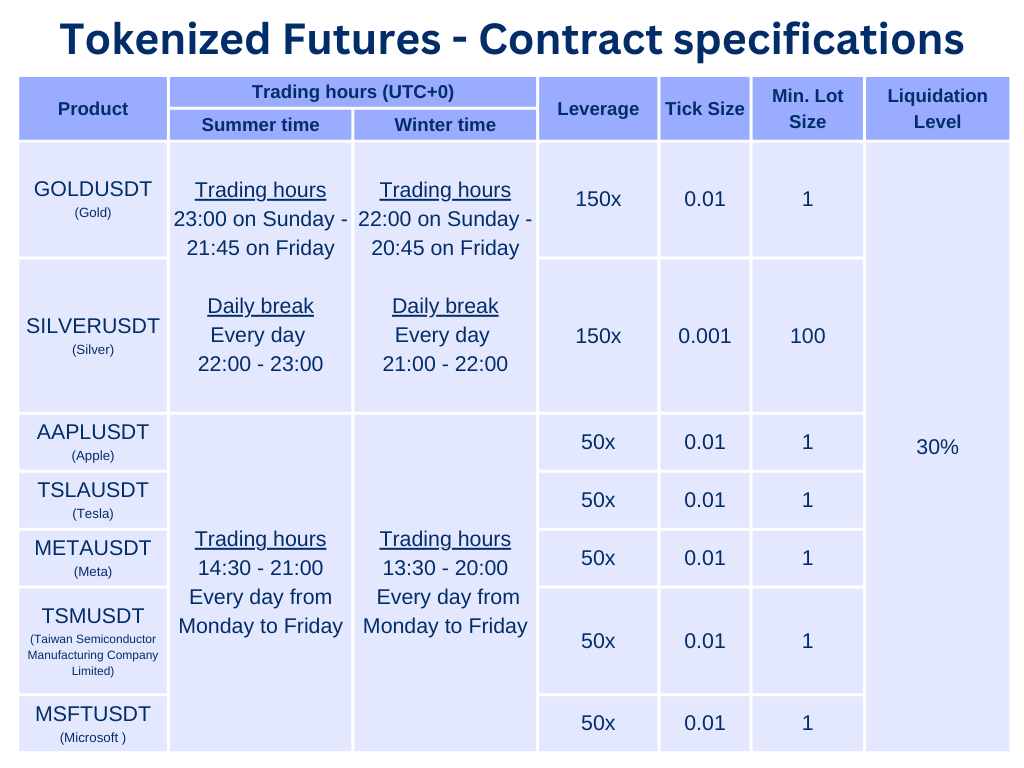
Where to Trade Tokenized Futures?
BTCC have also launched tokenized stock and commodity USDT-margined futures. Now you can trade gold, silver and stock on BTCC. These tokenized futures contracts are innovative products invented by BTCC, and users can trade stocks and commodities with USDT on our platform. Below are the details of the newly-added trading pairs.
BTCC offers exclusive bonus for new users. Sign up and deposit on BTCC to get up to 10,055 USDT in bonuses. Meet the deposit targets within 30 days after successful registration at BTCC, and you can enjoy the bonus of the corresponding target levels. Find out what campaigns are available now: https://www.btcc.com/en-US/promotions
| Download App for Android | Download App for iOS |
About BTCC
BTCC is a leading cryptocurrency trading platform that is distinguished by its ability to balance the simplicity of use with advanced features. It provides a comprehensive educational program through the BTCC Academy, 24/7 customer support, and robust security to both novices and experts. BTCC is a top choice for digital asset investors due to its emphasis on user contentment, which fosters a secure and informed trading environment across a variety of cryptocurrencies.
BTCC is one of the few exchanges in the market that offers high-leverage options for investors and concentrates extensively on futures trading. Users have access to more than 300 USDT-margined perpetual trading pairs, which encompass numerous prominent altcoins and meme-coins. Additionally, the platform has recently implemented spot trading to facilitate novice users who may not be acquainted with futures trading.
- Established Reputation: BTCC is one of the oldest and most well-known cryptocurrency exchanges, having been operational since 2011. Its history in the market enhances its credibility and trustworthiness.
- A Diverse Selection of Cryptocurrencies: BTCC allows customers to access and exchange a wide range of digital assets.
- Margin and Futures Trading: BTCC provides margin and futures trading options, allowing customers to expand their trading holdings and potentially increase their profits.
- Proficient Trading Instruments: such as real-time market data, trading charts, and technical analysis indicators. These tools can help users make informed trading decisions.
- Security Measures: BTCC values security and uses a variety of safeguards to secure customer payments and information. This includes two-factor authentication (2FA) and cold storage of cryptocurrency assets.
BTCC Guide:
- How to Trade Crypto Futures Contracts on BTCC
- BTCC Guide-How to Deposit Crypto on BTCC?
- What is Crypto Futures Trading – Beginner’s Guide
- What is Leverage in Cryptocurrency? How Can I Trade at 100X Leverage?
- BTCC Review 2024: Best Crypto Futures Exchange
Crypto Buying Guides:
- How To Buy Bitcoin (BTC)
- How To Buy Picoin
- How To Buy Ethereum (ETH)
- How To Buy Dogecoin (DOGE)
- How To Buy Pepe Coin (PEPE)
- How To Buy Ripple (XRP)
Crypto Prediction:
- Ethereum (ETH) Price Prediction 2024, 2025, 2030 — Will ETH Reach $10,000?
- Ethereum Price Prediction 2024, 2025, 2030: How High Can ETH Go in 2024?
- Bitcoin (BTC) Price Prediction 2024, 2025, 2030 — Is BTC a Good Investment?
- Ripple (XRP) Price Prediction 2024, 2025, 2030 — Will XRP Reach $1 After SEC Lawsuit?
- Pi Coin Price Prediction 2024,2025,2030 — Is Pi Coin a Good Buy?
- Pepe (PEPE) Price Prediction 2024, 2025, 2030 – Will PEPE Reach $1

Register now to begin your crypto journey
Download the BTCC app via App Store or Google Play
Follow us
Scan to download

- Terms & Agreement
- Customer Service
- Online Customer Support
- Report an Issue
- [email protected]
- [email protected]
Quick Links
Risk warning: Digital asset trading is an emerging industry with bright prospects, but it also comes with huge risks as it is a new market. The risk is especially high in leveraged trading since leverage magnifies profits and amplifies risks at the same time. Please make sure you have a thorough understanding of the industry, the leveraged trading models, and the rules of trading before opening a position. Additionally, we strongly recommend that you identify your risk tolerance and only accept the risks you are willing to take. All trading involves risks, so you must be cautious when entering the market.
The world’s longest-running cryptocurrency exchange since 2011 © 2011-2025 BTCC.com. All rights reserved
Comments
Leave a comment
Your email address will not be published. Required fields are marked with an asterisk (*).
Comment*
Name*
Email address*